Sydney Weather by Month: A Local's Guide to Temperatures, Rain and Seasons
Sydney's climate is milder and stranger than most visitors expect. The long-run records show a city whose wettest month is in winter, whose clearest skies arrive in August, and whose cloudiest month is the middle of peak tourist season.
Short answer
Sydney's long-run average maximum is 21.8 °C and its average minimum 13.8 °C. January is the hottest month at 26.0 °C, July the coolest at 16.4 °C. June is the wettest month with 133.1 mm on average, and August has the most clear days at 13.4. Rain falls on about 99.5 days a year, roughly one day in 3.7.
Sydney has one of the most liveable climates of any major city, and also one of the most misunderstood. Ask ten visitors what Sydney's weather is like and most will describe endless summer sunshine. The long-term records from the Bureau of Meteorology, measured at the Observatory Hill station in the city centre with 162 years of continuous observations, tell a more interesting story: a mild, temperate city where rainfall peaks in early winter, where the clearest skies of the year arrive in August, and where February, the heart of peak tourist season, is statistically the cloudiest month of all.
This guide walks through Sydney's weather month by month using those official long-term averages, not forecasts or impressions. It covers what each season genuinely delivers, which month gives you the best odds of good conditions, and how to plan around the quirks that catch visitors out, from daylight saving to the UV index in winter. Everything here is drawn from published climate normals and government sources, and the Sydney Travel Guide team keeps the underlying figures on file so the numbers stay honest.
What Is Sydney's Weather by Month?
Sydney's months run warm: January averages 26.0 °C by day and 18.8 °C overnight, while July, the coldest month, still averages 16.4 °C by day and 8.1 °C overnight. Rain falls somewhere between 68.1 mm and 133.1 mm every month of the year, so no season is dry. The full picture is a temperate, humid coastal climate with no true cold season and no true dry season.
That table is the backbone of everything else in this guide. The Bureau of Meteorology publishes these figures as long-term averages from station 066062 at Observatory Hill, near Circular Quay, with the temperature and rainfall record stretching back to 1858. They are averages, not promises: any individual January can be scorching or sodden, and any individual July can deliver a run of 20 °C days that feels like spring. But averaged across more than a century and a half, the pattern is remarkably stable.
| Month | Mean max °C | Mean min °C | Mean rainfall mm | Rain days (1 mm+) | Mean daily sunshine |
|---|---|---|---|---|---|
| Jan | 26.0 | 18.8 | 101.2 | 8.6 | 7.1 h |
| Feb | 25.8 | 18.9 | 119.3 | 9.0 | 6.7 h |
| Mar | 24.8 | 17.6 | 131.6 | 9.9 | 6.4 h |
| Apr | 22.5 | 14.8 | 126.5 | 8.9 | 6.4 h |
| May | 19.5 | 11.6 | 117.4 | 8.6 | 5.9 h |
| Jun | 17.0 | 9.3 | 133.1 | 8.8 | 5.5 h |
| Jul | 16.4 | 8.1 | 96.3 | 7.4 | 6.4 h |
| Aug | 17.9 | 9.0 | 80.2 | 7.1 | 7.1 h |
| Sep | 20.1 | 11.1 | 68.1 | 7.1 | 7.2 h |
| Oct | 22.2 | 13.6 | 76.7 | 7.9 | 7.2 h |
| Nov | 23.7 | 15.7 | 83.8 | 8.3 | 7.8 h |
| Dec | 25.3 | 17.6 | 77.1 | 7.9 | 7.6 h |
The source table is published by the Bureau of Meteorology, which maintains the Observatory Hill record as Sydney's official climate station. A few things jump out immediately. The temperature range between the hottest and coldest month is under 10 degrees, which is narrow by world standards. Rainfall never drops below 68 mm in any month, because Sydney has no dry season the way Perth or Adelaide does. And the sunshine column does not follow the temperature column: June has the least sunshine of any month, yet more clear days than January.
Which Are Sydney's Hottest Months?
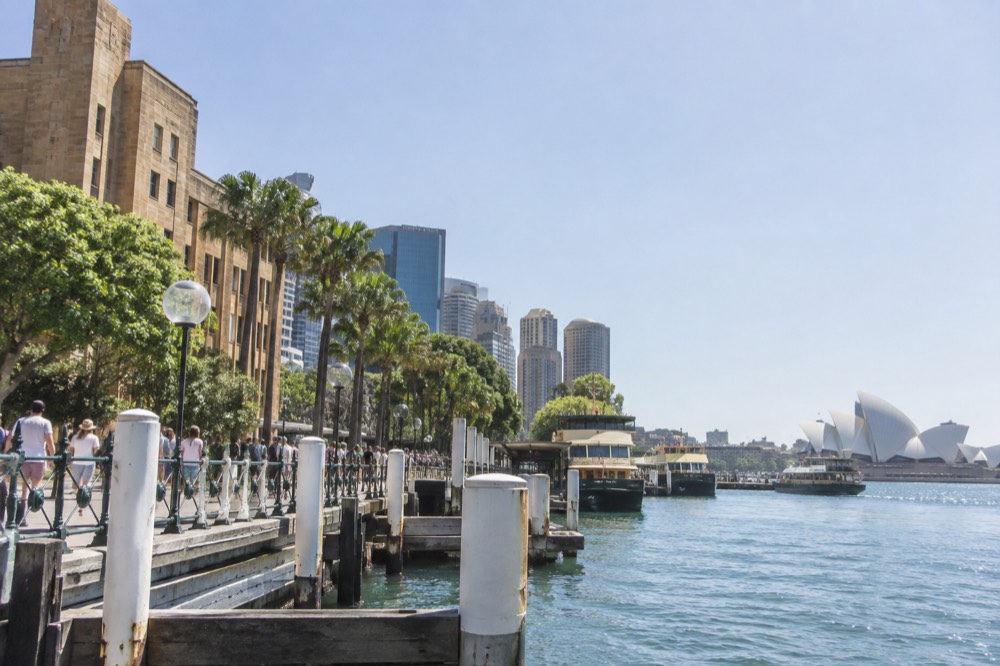
Sydney's hottest months are January and February, averaging 26.0 °C and 25.8 °C respectively, with March close behind at 24.8 °C. Overnight lows stay near 19 °C, so the heat barely breaks. December and January also deliver the most daily sunshine, around 7.1 and 7.6 hours, though February's sunshine drops to 6.7 hours as cloud builds.
Summer in Sydney means December, January and February, and it behaves differently from a northern hemisphere summer. Humidity is the defining feature: overnight minimums around 18.8 to 18.9 °C mean there is little relief after dark, and the combination of warmth and moisture feeds the afternoon thunderstorms that roll in from the west. Rain days sit at 8.6 to 9.0 per summer month, and the rain that falls is often heavy and brief rather than the all-day drizzle visitors from Britain or the Pacific Northwest might expect.
The beaches are the obvious summer draw, and this is the season when surf lessons, harbour swims and coastal walks are at their best. If you are planning around the water, our Bondi Beach guide and the best beaches in Sydney cover where to swim and what the patrol seasons look like. One caution belongs here rather than repeated later: always swim between the red and yellow flags at a patrolled beach, because rip currents are the coast's number one hazard and patrol hours vary by beach and season.
February deserves a special mention because it quietly undercuts the summer fantasy. It has the fewest clear days of any month in the entire year, just 5.3 on average, and it carries the second-highest rainfall total at 119.3 mm. The days that are fine are genuinely glorious, but a February week has a real chance of delivering more grey sky than a July one. Peak season prices and peak cloud arrive together, which is the single most counterintuitive fact in Sydney's climate record.
Summer is also festival season. Vivid Sydney has moved to late autumn and winter, but major events cluster through the warm months, and the harbour gets busy around Christmas and New Year. If you are weighing summer against other seasons, the best time to visit Sydney guide compares them all against crowd levels and prices.
What Is Sydney's Winter Weather Like?
Sydney's winter, from June to August, is mild rather than cold: average daytime maximums run 16.4 to 17.9 °C and overnight minimums 8.1 to 9.3 °C. Frost is rare near the coast, snow is effectively unheard of in the city, and rain eases through the season, from 133.1 mm in June down to 80.2 mm in August. Winter is Sydney's clearest time of year.
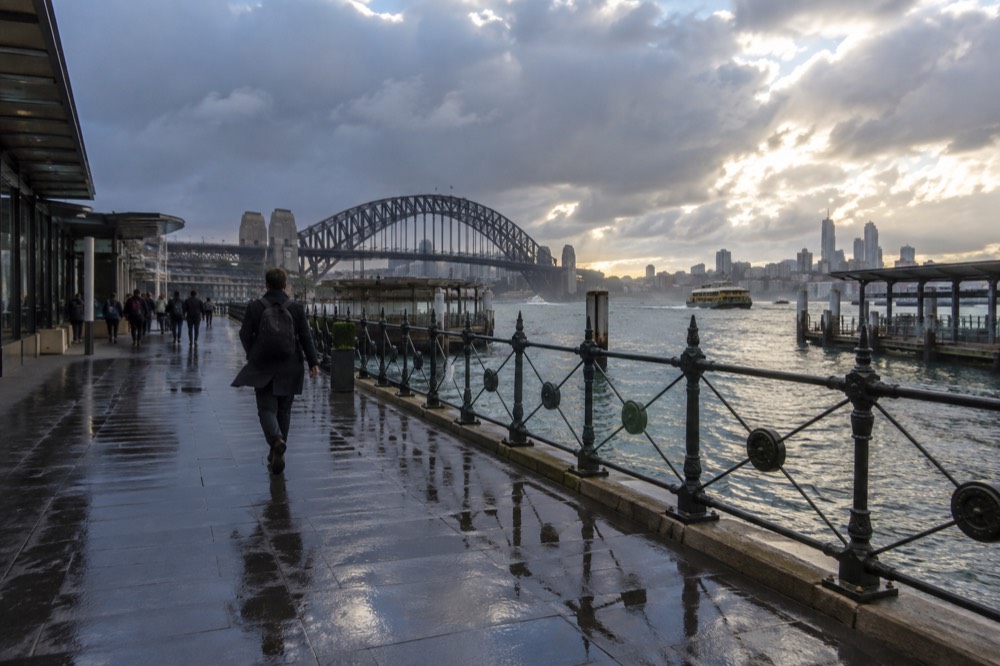
June, July and August are winter months in Sydney, and the first thing northern hemisphere visitors need to recalibrate is that "winter" here means jumper weather, not parka weather. Days of 17 or 18 °C are standard, and the sun, when it is out, carries real warmth. What catches people is the combination of clear skies and short days: June averages just 5.5 hours of daily sunshine, the lowest of the year, not because the sky is grey but because the days themselves are short.
The water is another matter. Ocean swimming in winter is possible for the hardy, and the city's ocean pools, including Bondi Icebergs and the free Bronte Ocean Pool, stay open, but most visitors give the sea a miss between June and August. Winter is instead the season for whale watching, coastal bluff walks, gallery days and long lunches. The whales run May to November, and our whale watching in Sydney guide covers the season in detail.
Winter is also when Sydney's most surprising weather statistic pays off for visitors. August records 13.4 clear days on average, the most of any month, and July records 12.0, the second most. A winter week can deliver crisp, bright, still days that are perfect for the Bondi to Coogee coastal walk or a ferry ride to Manly, and the queues at every major attraction are dramatically shorter than in February.
Between the clear-skies statistic and the short-day reality, winter rewards a different style of trip: one good outdoor block in the middle of the day, then indoor plans for the late afternoon. A food tour suits that rhythm exactly, since it runs in the evening hours when the temperature drops, and the Sydney rainy day itinerary covers the days when June's rain arrives on schedule.
What Is the Best Month to Visit Sydney for Good Weather?
On the records, the best month for reliably good weather in Sydney is October or November: daytime maximums of 22.2 to 23.7 °C, rainfall down to 76.7 and 83.8 mm, and daily sunshine back up to 7.2 and 7.8 hours. September is close behind and is the driest month of the year. These spring months beat summer on consistency, with far more clear days than February.
Spring, from September to November, is Sydney's sweet spot, and the numbers explain why. September is the driest month on record at 68.1 mm, October and November stay under 85 mm, and the temperature has climbed back into the low twenties without the humidity that makes January heavy. Sunshine hours in November, 7.8 a day, are the highest of any month in the year. You get summer's warmth without summer's cloud build-up, and without peak season's crowds.
For travellers who want heat rather than comfort, January and early December remain the months to target, and the Sydney in December and Sydney in summer guides cover what those months deliver in full, from beach conditions to event calendars. But if the question is strictly about weather quality, the answer is late spring. The harbour is warm enough for every cruise and kayak, the coastal walks are at their greenest after the winter rain, and the UV is serious but not yet at its December-to-February extreme.
There is a trade-off worth naming honestly: spring is also when the city's event calendar is quieter than summer and warmer than winter, so some visitors find it lacks a headline occasion. That is a matter of taste rather than weather. For pure, day-after-day usable conditions, October and November win on every metric the Bureau measures.
Which Is the Wettest Month in Sydney?
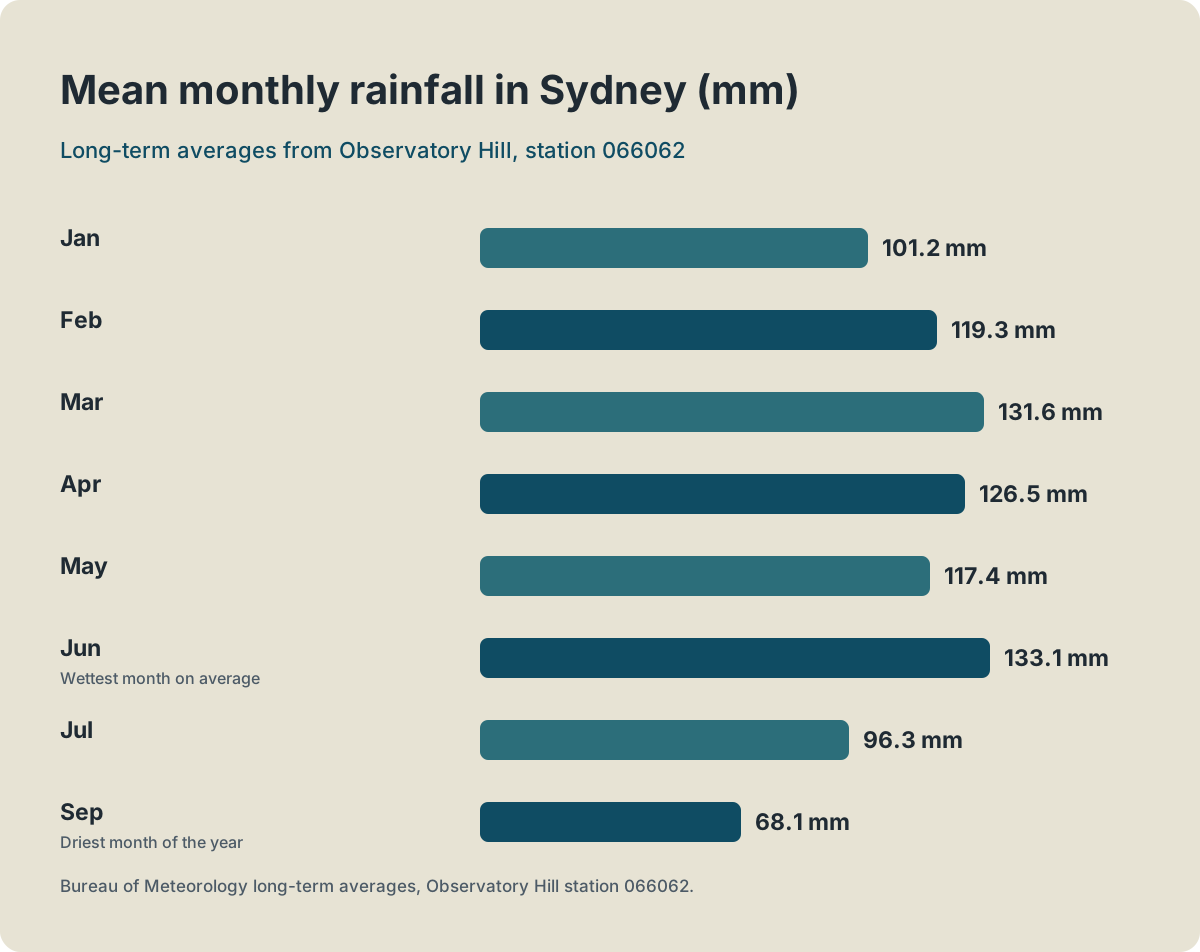
June is Sydney's wettest month, with an average of 133.1 mm of rain, more than any summer month and 1.7 times September's 68.1 mm. March and April follow closely at 131.6 and 126.5 mm. Rain days, though, stay fairly flat across the year at 7.1 to 9.9 days a month, meaning winter rain falls harder rather than more often.
The June statistic is the one that surprises almost everyone, including Australians from drier cities. The mental model of Sydney is a summer beach city, so visitors assume the rain must come in winter storms and summer must be dry. The reality is that Sydney's rainfall peaks in autumn and early winter, and the wettest stretch of the year runs from March through June, four consecutive months above 117 mm. Summer rain, when it comes, is more likely to arrive as short, heavy downpours and afternoon storms.
Rain days tell the other half of the story. March has the most days with at least 1 mm of rain, 9.9 on average, and August and September tie for the fewest at 7.1. So the difference between a wet month and a dry one in Sydney is mostly about intensity, not frequency. A June trip is not a washout: it is a month where roughly one day in three sees rain, and where the rain that falls tends to be steady and frontal rather than dramatic.
| Month | Mean rainfall | Rain days | Mean clear days | Clear-day rank |
|---|---|---|---|---|
| Jun | 133.1 mm | 8.8 | 9.1 | 8th |
| Mar | 131.6 mm | 9.9 | 7.1 | =11th |
| Apr | 126.5 mm | 8.9 | 9.1 | 8th |
| Feb | 119.3 mm | 9.0 | 5.3 | 13th |
| May | 117.4 mm | 8.6 | 9.5 | 6th |
| Jan | 101.2 mm | 8.6 | 6.8 | 10th |
| Jul | 96.3 mm | 7.4 | 12.0 | 2nd |
| Dec | 77.1 mm | 7.9 | 6.6 | =11th |
| Oct | 76.7 mm | 7.9 | 8.1 | 7th |
| Nov | 83.8 mm | 8.3 | 6.0 | 12th |
| Aug | 80.2 mm | 7.1 | 13.4 | 1st |
| Sep | 68.1 mm | 7.1 | 10.9 | 3rd |
When Are Sydney's Skies Clearest?
Sydney's clearest skies arrive in late winter: August averages 13.4 clear days and July 12.0, the two highest months of the year. February is the cloudiest at just 5.3 clear days, and November and March also rank near the bottom. The paradox is that Sydney's peak tourist season overlaps with its cloudiest skies, while its clearest weather falls in the low season.
This is the fact most worth carrying into your planning, because it inverts the usual logic of booking a beach city. The clear-day count comes from the Bureau's long-run record of days classified as clear versus cloudy, and it shows a city whose sky is at its brightest blue in the middle of what everyone calls winter. June complicates the picture slightly, since it pairs those clear winter skies with the year's heaviest rainfall: when it is not raining in June, the sky is often brilliantly clear, but the rain days carry a lot of water.
The mechanism is worth a sentence of explanation. Sydney's winter skies are dominated by clear, dry air masses between cold fronts, so the sky alternates between crisp blue and grey rain rather than sitting under the hazy humid cloud that blankets the city through much of February. Summer's cloud is the soft, persistent kind: still warm, still swimmable, but rarely the postcard blue of an August morning.
For photographers this matters enormously, and the best lookouts in Sydney and Sydney photography spots guides are best served by the winter and spring months, when morning light is clean and the air is at its least hazy. The same logic applies to the harbour cruises and bridge experiences: the view is sharper in July than in February, even at ten degrees cooler.
How Does Daylight Saving Change Sydney's Months?
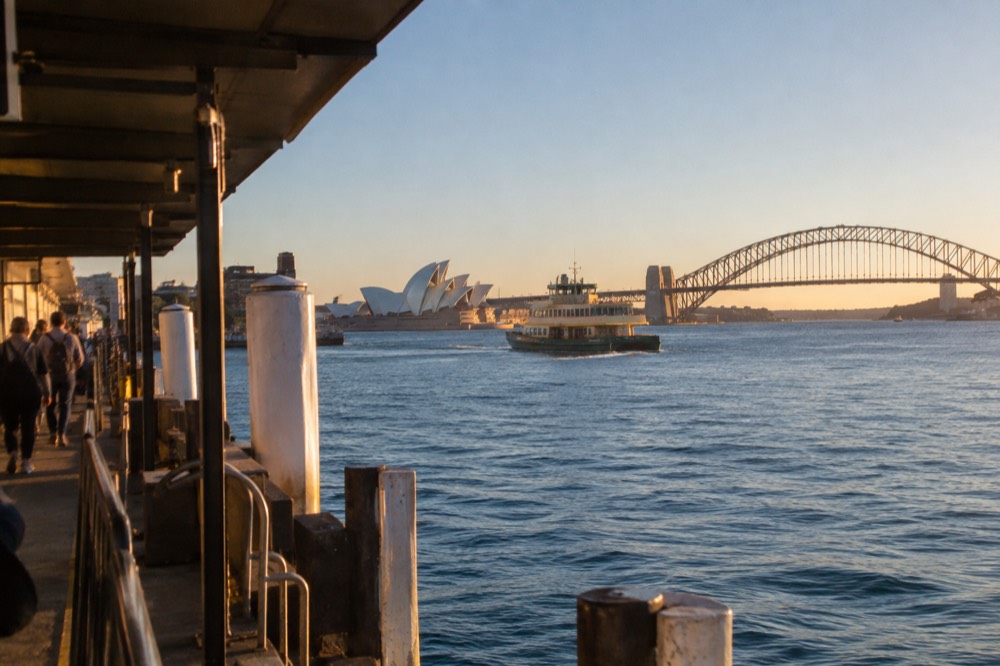
Daylight saving in NSW runs from the first Sunday in October to the first Sunday in April, shifting clocks forward one hour to AEDT. In 2026 it begins on Sunday 4 October and ends on Sunday 4 April 2027. The effect is that summer evenings stay light until around 8pm, while winter evenings darken by 5:30pm, a swing of well over two hours of usable evening light.
The dates are set by the NSW Government and published on its official daylight saving page, and they matter more for itinerary planning than most visitors realise. A summer trip gives you long evenings: the post-work harbour is still in full sun, sunset cruises leave in daylight, and outdoor dining runs late. A winter trip inverts that, with first light around 7am and darkness well before 6pm, which is why winter itineraries should front-load outdoor sights and save galleries, dinners and theatre for the late afternoon.
Queensland, by contrast, does not observe daylight saving, so the time difference between Sydney and Brisbane shifts between one hour and zero across the year. Anyone connecting through the Northern Beaches to flights or tours up the coast should double-check times in the shoulder months of April and October, when the two states disagree about the clock.
The UV index is the other clock worth respecting. Sydney's UV reaches extreme levels of 11 or more in summer and still regularly exceeds 3 in winter, which is the threshold at which sun protection is advised. Even in early spring the daily peak can pass 4 by early afternoon, so sunscreen is a year-round item in Sydney, not a summer one.
What Should You Pack for Sydney's Weather?
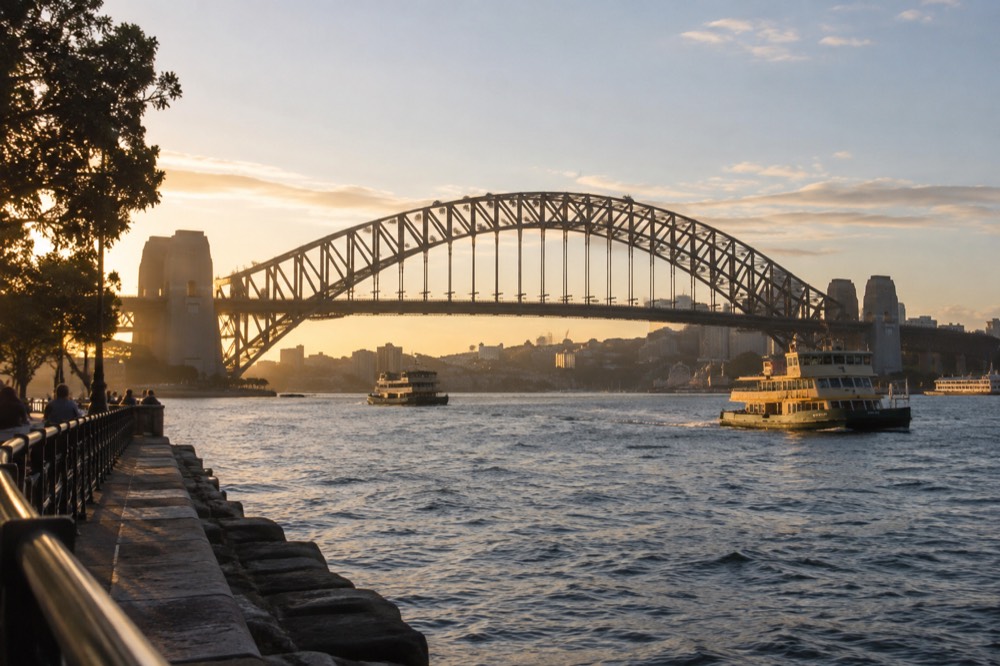
Pack for mild conditions and changeable skies rather than extremes: light layers that work from 8 °C to 26 °C, a proper rain jacket for any month, and sun protection year-round. Even in January, evenings by the water drop to around 19 °C and air-conditioned interiors are cold. In July, daytime sun on a sheltered northern beach can feel like 20 °C, so a heavy coat is overkill.
Sydney's narrow temperature range means the classic mistake is over-packing for winter and under-packing for rain. There is no month where a rain jacket is pointless, and no month where a warm layer is pointless. The table below matches the four seasons to what actually earns its place in a suitcase.
| Season | Months | Typical range | What to pack |
|---|---|---|---|
| Summer | Dec, Jan, Feb | 19-26 °C | Swimwear, sunscreen, light clothing, a layer for air-conditioning, an umbrella for storms |
| Autumn | Mar, Apr, May | 12-25 °C | Layers, rain jacket, comfortable walking shoes for wet days |
| Winter | Jun, Jul, Aug | 8-18 °C | Jumper or light jacket, warm evenings wear, sunglasses for the clear days |
| Spring | Sep, Oct, Nov | 11-24 °C | Mixed layers, swimwear for late spring, sun protection, light rain gear |
Footwear deserves a specific mention because Sydney is a walking city with a lot of sandstone steps and coastal track. The getting around Sydney guide covers transport in depth, but weather-wise, the coastal walks that anchor most itineraries are exposed to wind and occasional spray, and wet sandstone is genuinely slippery. Trail-appropriate shoes earn their weight in every season.
One packing item visitors under-rate is the sun hat, in every month. The UV explanation above is not a summer-only caution: Sydney's latitude means the sun is strong enough to burn on a clear July afternoon, and the combination of cool air and high UV catches people out precisely because it does not feel hot.
Does Sydney's Weather Affect Which Tours You Can Book?
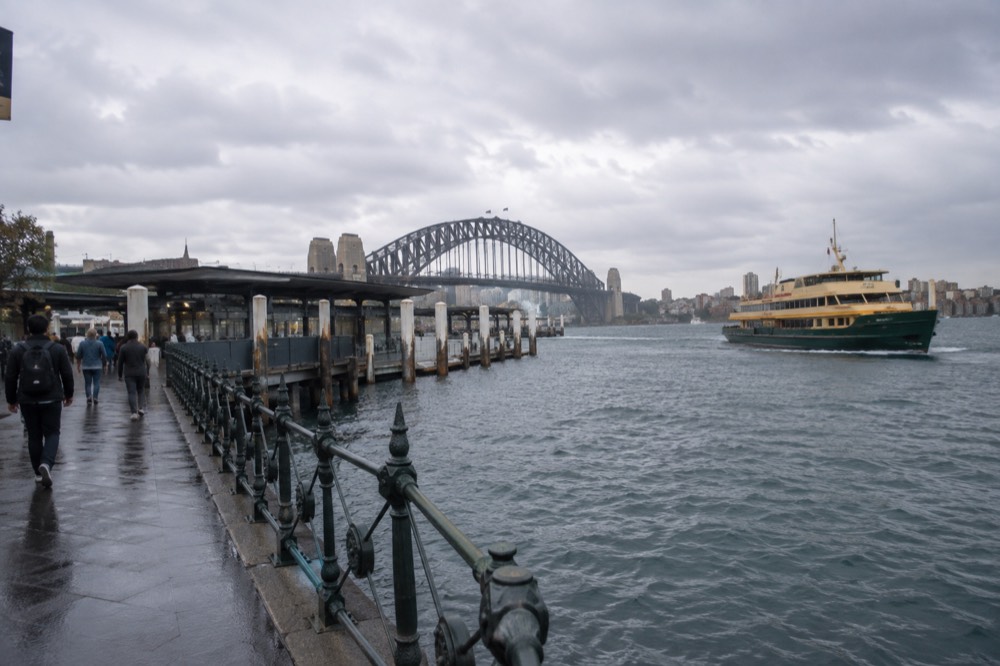
Yes, but less than you might expect: Sydney's tours run in every month, and the main seasonal cut-off is whale watching, which operates only from May to November. Water activities like kayaking and snorkelling are best from November to April, while harbour cruises, food tours and walking tours run year-round and are often more comfortable in the cooler months.
The seasonal logic is simple once you have the monthly table in your head. The water-sport window, surfing, snorkelling, kayaking, runs with the warm months and is at its best between November and April when both air and activity operators are in full swing. The whale window is the mirror image: May to November, with the peak around late June and July, which means the best whale months overlap with the clearest, coolest weather. A winter trip can pair a morning whale cruise with a bright afternoon walk, which is a genuinely better day than most summer itineraries manage.
Everything else is year-round. The Opera House tours, the BridgeClimb experiences, the food and walking tours and the harbour cruises all operate through winter, and the operators supply weather gear where it matters, so a cool day costs you nothing but a jacket. The things to do in Sydney overview and the Sydney walking tours guide list the full spread of options by category.
The practical planning advice is to book weather-dependent activities with a day or two of slack in your itinerary, and keep the flexible indoor options for the day the forecast turns wet. June's rain is predictable in the monthly average but not in the weekly detail, and a Sydney trip that keeps one swap-ready day is a Sydney trip that never loses a day.
How Does Sydney's Weather Compare Month to Month for a Short Trip?
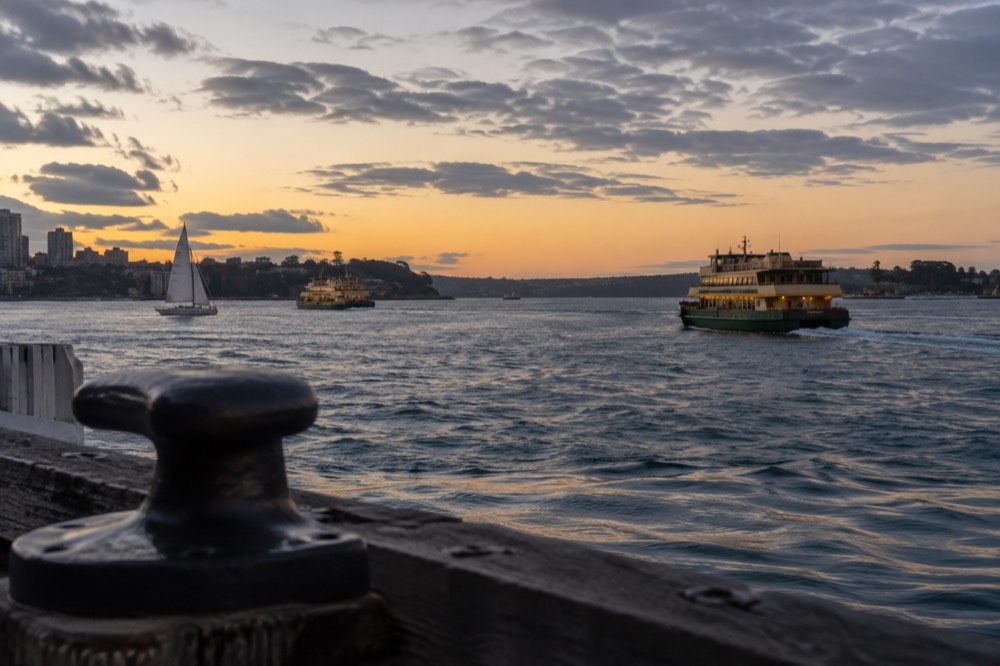
For a short trip of three or four days, the months with the best odds of uninterrupted good weather are October, November and September, in that order. They combine the year's lowest rainfall, 68.1 to 83.8 mm, with 7.2 to 7.8 hours of daily sunshine and daytime temperatures in the low twenties. A short summer trip carries the highest heat but also the highest chance of losing a day to storms.
Short trips change the calculus, because a single wet day costs a quarter of your visit. The monthly averages matter more when your sample size is small, and that is when the February problem bites hardest: 5.3 clear days and 119.3 mm of rain in the month means a four-day February visit has a real chance of drawing two grey days. The same four days in October are far more likely to be uniformly fine.
The itinerary guides are built around exactly this problem. The 1 day in Sydney and 3 days in Sydney plans each include an all-weather spine, with the harbour and the walkable centre as the reliable core and the weather-dependent extras arranged around it. If you are choosing your travel dates with flexibility, aim for late October, and if you are locked to February, plan for the possibility of indoor days rather than being surprised by them.
Common Questions About Sydney Weather by Month
What is the best month to visit Sydney for good weather?
October and November offer the best overall weather, with daytime maximums of 22.2 to 23.7 °C, the year's lowest rainfall stretch after September, and the highest daily sunshine of any month. September is the driest month at 68.1 mm on average. Summer is hotter but cloudier, and February is statistically the city's cloudiest month.
Which is the hottest month in Sydney?
January, with an average daily maximum of 26.0 °C and an overnight minimum of 18.8 °C. February is a close second at 25.8 °C, and the two months also carry the summer's highest humidity, so the heat barely eases overnight.
Which is the coldest month in Sydney?
July, averaging 16.4 °C by day and 8.1 °C overnight. It is a mild winter by world standards: frost is rare near the coast, snow does not fall in the city, and July also records the second-most clear days of any month, 12.0 on average.
Which is the wettest month in Sydney?
June, with an average of 133.1 mm of rain, the highest of any month and wetter than every summer month. The wet stretch of the year runs from March through June, while September is the driest month at 68.1 mm.
Is Sydney's weather good in winter?
Yes, in a specific way: winter days are mild, typically 16 to 18 °C, and the skies are the clearest of the year, with August averaging 13.4 clear days. The trade-offs are short days, cool nights around 8 to 9 °C, and June's heavy rainfall.
Does it rain all day in Sydney when it rains?
Usually not. Sydney averages 7.1 to 9.9 rain days a month, fairly flat across the year, so the difference between wet and dry months is intensity rather than frequency. Summer rain tends to arrive as brief heavy storms, while winter rain is more often steady and frontal.